What Is a Battery Management System? Guide for Automotive Applications
Read the CADFEM guide to smart BMS functions, automotive thermal management, centralized vs. modular architectures, and Ansys simulation
Read Article →
While theoretical models provide a foundation for understanding diffraction, simulation tools like Zemax allow optical engineers to visualize, analyze, and optimize optical systems before physical prototyping.
Diffraction is a fundamental optical phenomenon that occurs when light interacts with an obstacle or aperture, bending and spreading rather than traveling in a straight line. This effect plays a crucial role in imaging, laser optics, and wavefront propagation, where precise control of light behavior is essential. Accurately understanding diffraction patterns is key to optimizing optical system performance, reducing aberrations, and improving image quality in various applications.
While theoretical models provide a foundation for understanding diffraction, simulation tools like Zemax allow optical engineers to visualize, analyze, and optimize optical systems before physical prototyping. This blog explores the diffraction of light through a circular aperture by comparing classical theoretical predictions with Zemax simulations, demonstrating how simulations complement and enhance optical design processes.
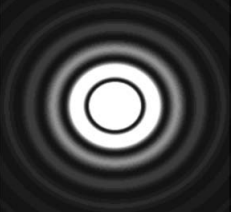
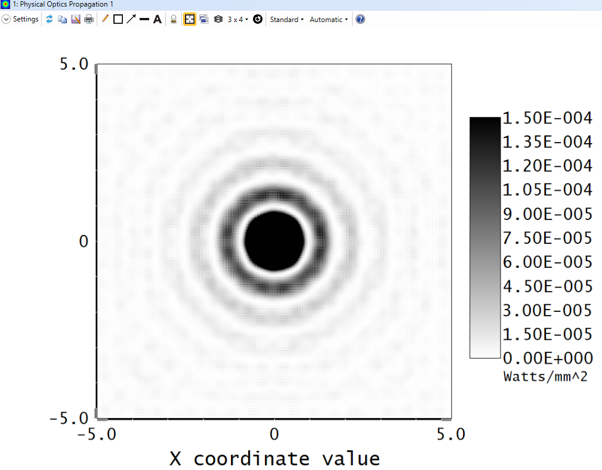
Diffraction through a circular aperture is best described by the Airy pattern, named after George Biddell Airy. When a plane wave passes through a circular aperture, it produces a characteristic diffraction pattern composed of:
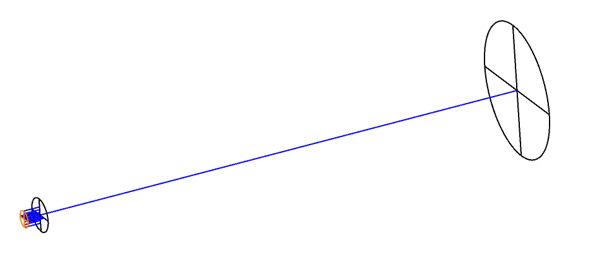
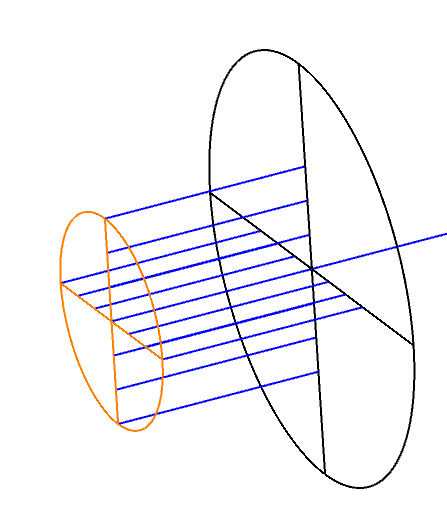
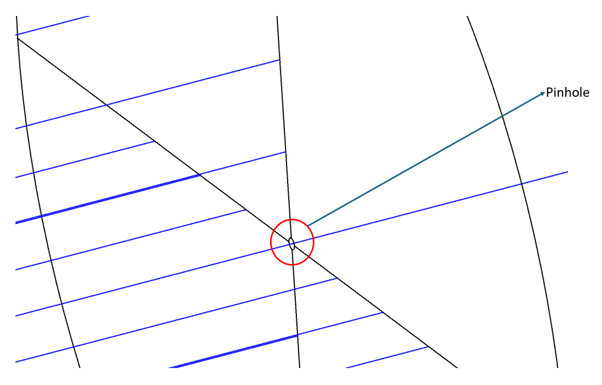
Collimated beam of size larger than pinhole is incident on the pinhole and the parameters of the Fresnel diffraction setup are:
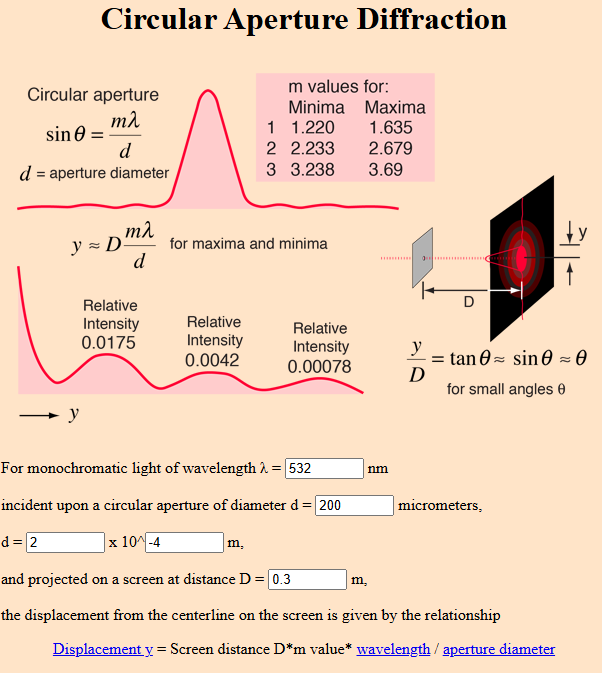
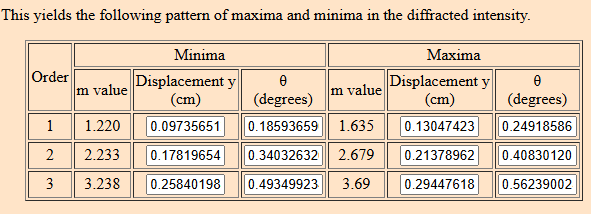
Ref. article used Circular Aperture Diffraction from hyperphysics
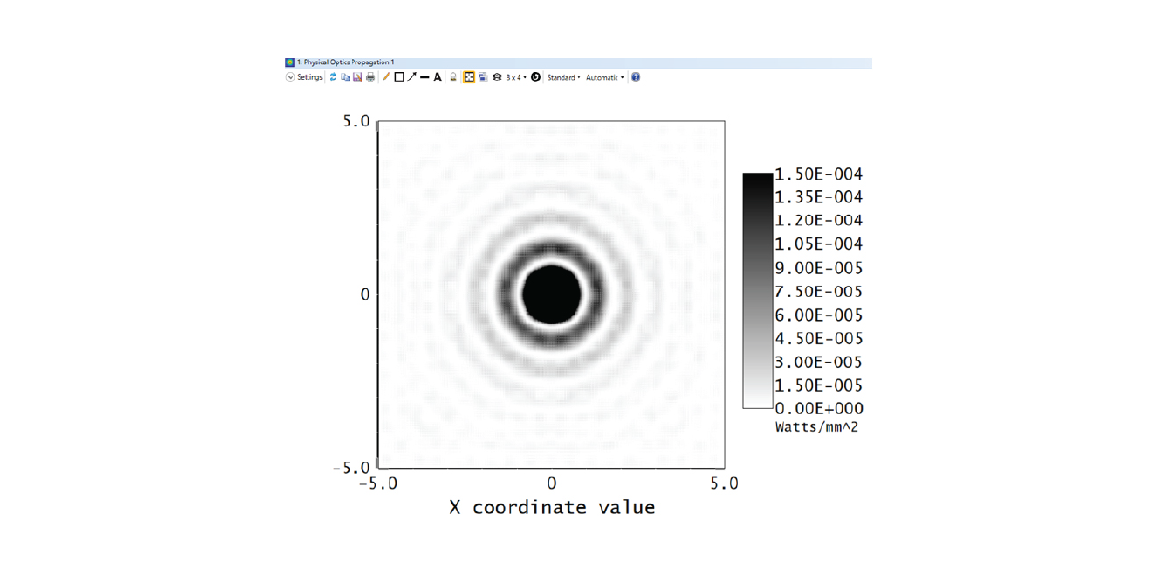
Zemax offers powerful tools for modelling diffraction effects using both physical optics propagation (POP) and wavefront analysis. To simulate diffraction through a circular aperture:
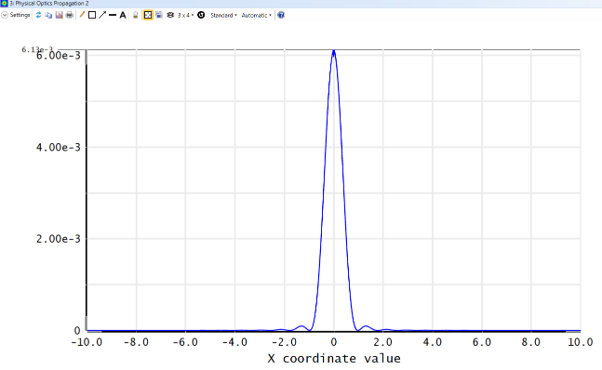
| Order | Minima | Maxima | ||
|---|---|---|---|---|
| m value | Displacement Y (mm) | m value | Displacement Y (mm) | |
| 1 | 1.22 | 0.9793 | 1.635 | 1.313 |
| 2 | 2.233 | 1.778 | 2.679 | 2.129 |
| 3 | 3.238 | 2.572 | 3.69 | 2.910 |
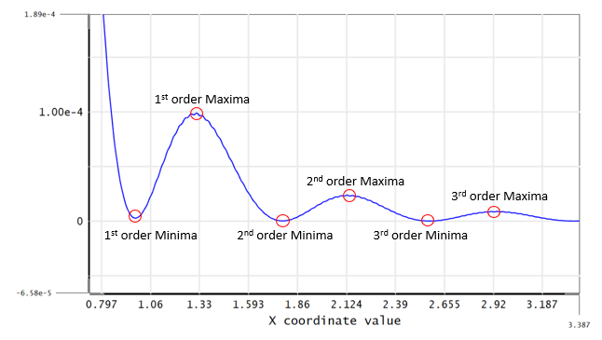
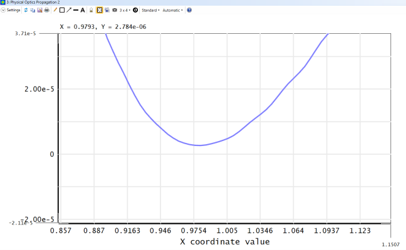
| Order | Minima | Maxima | ||||
|---|---|---|---|---|---|---|
| m value | Displacement Y (mm) Theory | Displacement Y (mm) Simulation | m value | Displacement Y (mm) Theory | Displacement Y (mm) Simulation | |
| 1 | 1.22 | 0.9735 | 0.9793 | 1.635 | 1.304 | 1.313 |
| 2 | 2.233 | 1.781 | 1.778 | 2.679 | 2.137 | 2.129 |
| 3 | 3.238 | 2.584 | 2.572 | 3.69 | 2.944 | 2.910 |
Understanding and controlling diffraction is critical in optical engineering, particularly in applications like microscopy, laser beam shaping, astronomy, and imaging systems. While theoretical principles lay the groundwork, Ansys Zemax simulations provide a practical and visual approach to verifying and refining optical designs.
By integrating simulation with theoretical analysis, engineers can bridge the gap between fundamental physics and real-world implementation, leading to more efficient, high-performance optical systems. Whether refining lens apertures, optimizing diffraction gratings, or enhancing laser beam propagation, Zemax enables innovation in optical design through accurate, simulation-driven insights.
{/* The supplied webinar URL (/startup-acceleration-innovate-optics-with-ansys-zemax/) returns 404 — no such route or event exists. Left unlinked rather than shipping a dead link; restore the anchor once the real URL is known. */}
Are you from a startup looking to gain actionable strategies to improve design efficiency and bring cutting-edge optical products to market with confidence using Ansys Zemax? Then register now for our upcoming webinar.
 Multi Physics
Read the CADFEM guide to smart BMS functions, automotive thermal management, centralized vs. modular architectures, and Ansys simulation
Read Article → Structures
Di tengah pesatnya perkembangan teknologi rekayasa, adopsi CAE di Indonesia menjadi kunci utama dalam meningkatkan efisiensi dan produktivitas berbagai sektor industri.
Read Article → Electronics
Learn how to use Ansys HFSS SBR+ for 77 GHz automotive radar simulation, evaluating radome effects, antenna performance, radiation patterns, and installation.
Read Article →Connect with CADFEM experts for advanced simulation, automation, and engineering solutions tailored to your industry.